

Academy > Market Structure
Using Open Interest with Market Structure
Open Interest provides valuable information about where option traders have established positions. By itself, Open Interest is just a number. When combined with other market structure indicators, it can help traders better understand the current options market. The goal isn't to predict what the stock will do next. It's to build a more complete picture before making a trading decision.
Start with Open Interest
Open Interest shows how many option contracts remain open at each strike price. Large concentrations of Open Interest may identify price levels that traders are watching closely. These areas often become the starting point for market structure analysis.
Compare Put and Call Activity
Once you've identified the largest Open Interest levels, compare the put side and the call side.
For example:
- Large Put Open Interest at $18
- Large Call Open Interest at $20
- Current Stock Price: $18.75
This immediately shows where significant option activity is concentrated above and below the current stock price.
Add Other Market Structure Indicators
Open Interest becomes more useful when viewed alongside other information, such as:
- Put Walls
- Call Walls
- Max Pain
- Current stock price
- Expiration date
Looking at these indicators together often provides more context than relying on any single value.
Build a Complete Picture
Imagine a stock trading at $18.75.
The option chain shows:
- Put Wall at $18
- Call Wall at $20
- Max Pain near $19
- Strong Open Interest at both levels
Rather than asking: "Will the stock reach $20?" A trader may instead ask: "What does the overall market structure tell me about the current options market?" This approach encourages informed decision-making instead of focusing on a single prediction.
Market structure doesn't replace good trading decisions. It provides additional context that can help traders better understand the environment they are trading in. No single indicator tells the whole story, but together they can provide valuable insight into the options market.
OptionLogic in Practice
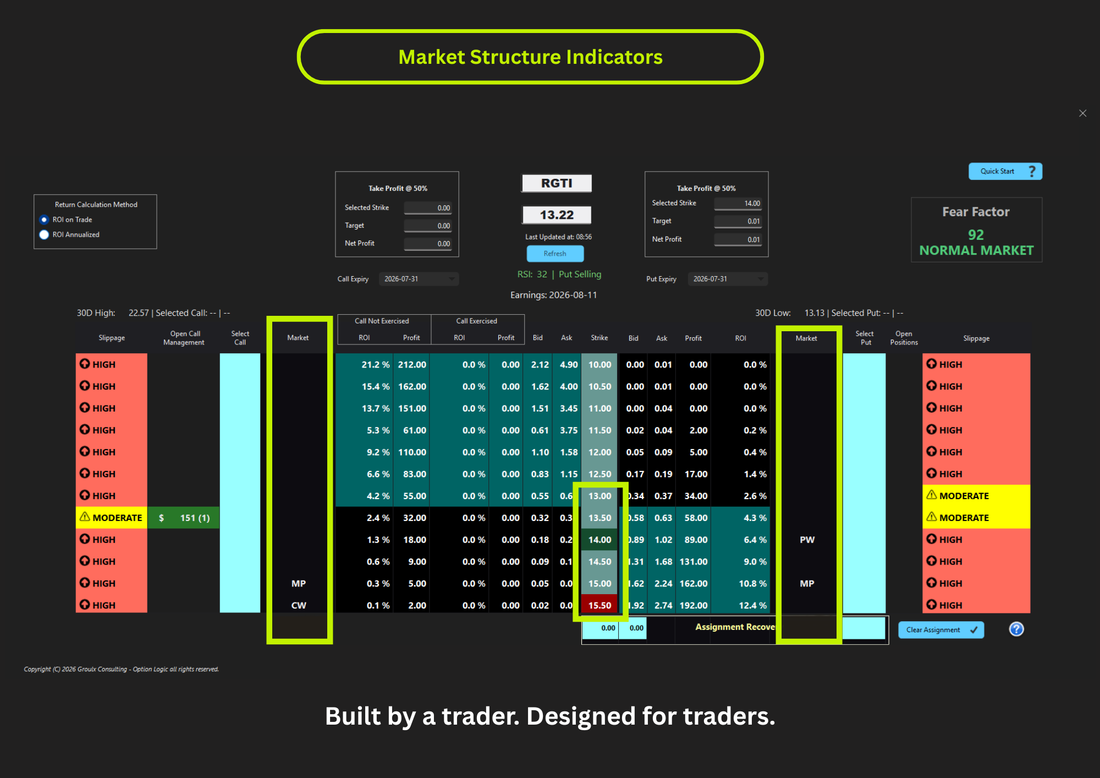
OptionLogic brings these market structure concepts together by highlighting Put Walls, Call Walls, and Max Pain within the option chain.
Instead of requiring traders to search through thousands of option contracts, the software helps identify important areas of option activity so they can be evaluated alongside premium, ROI, strike selection, and other trading considerations.
Frequently Asked Questions
Should I rely on Open Interest alone?
No. Open Interest is most useful when combined with other market structure information.
Does Open Interest predict stock prices?
No. It shows where option positions exist, but it does not predict future price movement.
Why combine multiple indicators?
Each indicator provides a different piece of information. Looking at them together often provides a better understanding of market conditions.
Does market structure guarantee support or resistance?
No. Market structure identifies areas of interest, not guaranteed turning points.
How does OptionLogic help?
OptionLogic highlights key market structure indicators so traders can quickly identify important areas of option activity without manually reviewing every strike price.
Continue Learning