

Academy > Market Structure
Support & Resistance Using Open Interest
Academy->Support & Resistance Using Open Interest
Support and resistance are price levels where a stock may slow down, reverse, or pause. Many traders identify these levels using price charts. Others also study Open Interest to understand where large numbers of option contracts are concentrated. The idea is simple: Large option positions may influence trading activity around certain strike prices.
What Is Support?
Support is a price level where buying interest may be strong enough to slow or stop a decline.
If many put options have accumulated at a particular strike price, some traders believe that level may act as support.
For example:
- Stock Price: $18.40
- Large Put Open Interest: $18.00
Some traders view the $18 strike as an important level because many option positions exist there.
What Is Resistance?
Resistance is a price level where selling pressure may slow or stop an advance. If many call options are concentrated at a strike price, some traders believe that level may act as resistance.
For example:
- Stock Price: $18.40
- Large Call Open Interest: $20.00
Some traders monitor the $20 strike as a possible resistance level.
Does Open Interest Create Support or Resistance?
Not necessarily. Open Interest does not guarantee that a stock will stop or reverse at a particular price. It simply highlights where a large number of option contracts exist. Some of these levels may influence market behaviour, while others may have little effect. They should be viewed as areas of interest rather than guaranteed turning points.
Why Do Traders Watch These Levels?
Large concentrations of option contracts can reveal where market participants have shown the most interest.
Combined with other information, these levels may help traders better understand the current market structure.
Many traders compare Open Interest with:
- The current stock price.
- Put Walls.
- Call Walls.
- Max Pain.
- Technical support and resistance.
Looking at several factors together provides more context than relying on a single indicator.
OptionLogic in Practice
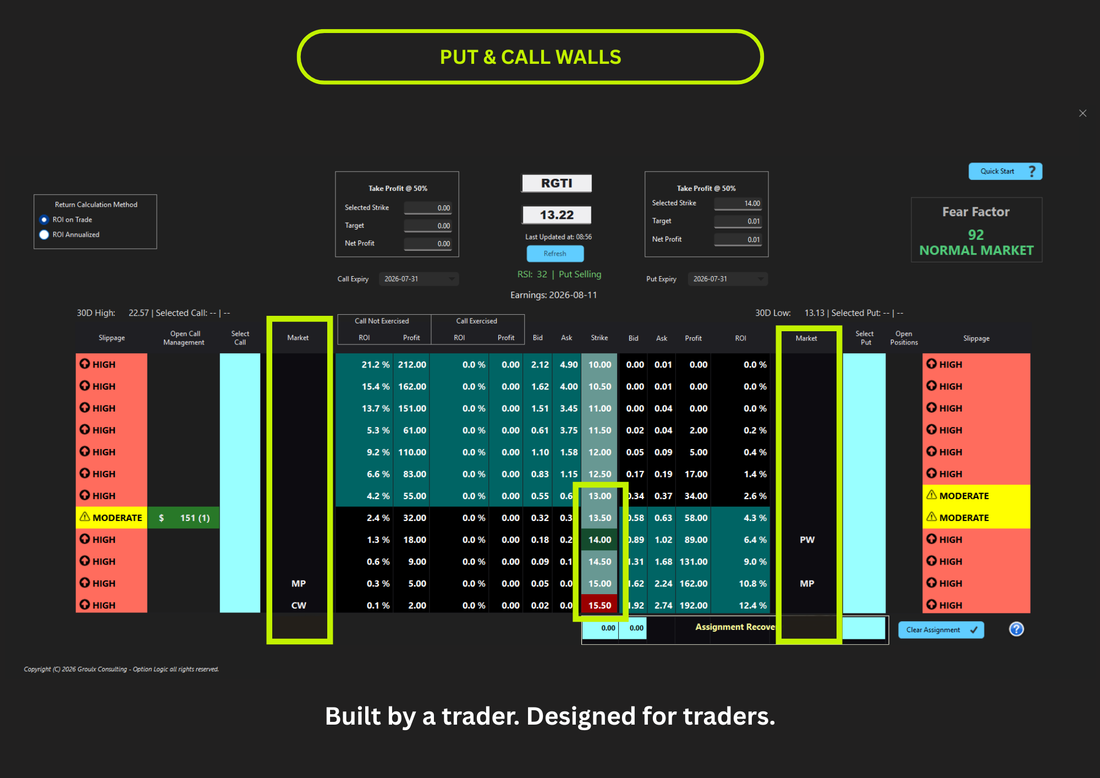
OptionLogic identifies the largest concentrations of Put and Call Open Interest and highlights them as Put Walls and Call Walls.
These levels are presented as part of the overall market structure, helping traders quickly identify areas where option activity is concentrated.
Frequently Asked Questions
Does high Open Interest guarantee support or resistance? No. High Open Interest identifies areas where many option contracts exist, but it does not guarantee how the stock price will react.
Why do traders watch Put Walls?
Large Put Open Interest may indicate a price level that traders consider important when evaluating possible support.
Why do traders watch Call Walls?
Large Call Open Interest may indicate a price level that traders consider important when evaluating possible resistance.
Should Open Interest be used by itself? No. Most traders evaluate Open Interest alongside other information such as price action, volume, technical analysis, and market structure.
How does OptionLogic use Open Interest?
OptionLogic highlights the largest concentrations of Put and Call Open Interest as Put Walls and Call Walls, making them easier to identify within the option chain.
Continue Learning