

Academy > OptionLogic
Dashboard Overview
Academy->Dashboard Overview
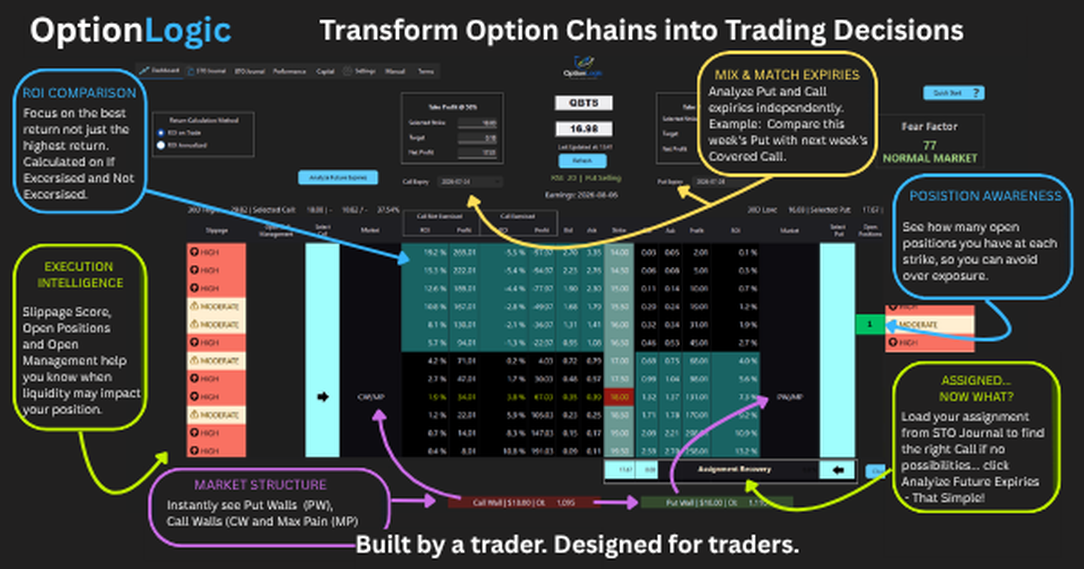
The Dashboard is the heart of OptionLogic. This is where you analyze option chains, compare trading opportunities, and evaluate positions using information that goes beyond the standard option chain. Rather than displaying raw market data alone, OptionLogic transforms option chains into meaningful trading information, helping you better understand possible outcomes before making a trading decision.
Put and Call Tables
The Dashboard displays both the Put and Call option chains side by side.
This allows you to quickly compare:
- Strike prices
- Premiums
- Return on Investment (ROI)
- Annualized ROI
- Slippage
- Market Structure
- Expiration dates
Viewing both sides of the option chain together provides additional context when evaluating potential trades.
Decision Support
Every option contract contains dozens of pieces of information. OptionLogic organizes that information into simple, meaningful metrics that help you compare opportunities more efficiently.
Instead of focusing on premium alone, you can evaluate:
- Return on Investment
- Annualized ROI
- Slippage
- Market Structure
- Earnings awareness
- Position metrics
These tools are designed to support your decision-making - not replace it.
Market Structure
OptionLogic automatically analyzes the displayed option chain and highlights important areas of market positioning.
This includes:
- Put Walls
- Call Walls
- Market Structure indicators
These insights provide additional context when evaluating option opportunities.
Position Information
As you evaluate options, OptionLogic continuously updates important position information such as:
- Estimated premium
- Cost basis
- Position value
- Potential returns
This allows you to understand how each option may affect your overall position before opening a trade.
Recovery Analysis
If you already own assigned shares, the Dashboard provides direct access to Recovery Analysis. This feature analyzes future covered call opportunities based on your current cost basis and compares positive recovery possibilities. Rather than recommending a single trade, Recovery Analysis helps you compare multiple potential outcomes.
Designed for Better Decisions
The Dashboard was designed around one simple idea: Provide meaningful information not more information. Every calculation, indicator, and metric is intended to help you better understand your options before making a trading decision.
Frequently Asked Questions
What is the Dashboard used for?
The Dashboard is where you analyze option chains, compare opportunities, and evaluate positions using OptionLogic's decision-support tools.
Does the Dashboard show live option data?
Yes. OptionLogic retrieves live option data and performs additional calculations to provide meaningful trading information.
Can I compare multiple expirations?
Yes. Changing the expiration updates the option chain and recalculates all associated metrics.
What makes the Dashboard different from a standard option chain?
OptionLogic adds decision-support information such as ROI, annualized ROI, slippage, market structure, and position analysis, making it easier to compare opportunities.
Is the Dashboard intended to recommend trades?
No. The Dashboard is designed to organize information so traders can evaluate possible outcomes and make informed decisions.
Continue Learning
➡ Settings